Publications
Quantifying the Impact of Sampling Error in Composite Index Construction
Abstract: Composite indicators are widely used to assess multifaceted phenomena; however, they rarely account for the uncertainty inherent in input data. This study quantifies the uncertainty of composite index scores by propagating sampling error from input data, providing a foundation for more effective decision-making by reducing maladaptation when data quality is ignored. We analyze how the margin of error (MOE) propagates across different methodological configurations, including normalization, aggregation, and weighting, and conduct global sensitivity analysis to compare its influence against conventional design parameters. Results show that index scores are shaped as much by methodological choices as by empirical realities. We argue that data gaps and unknown unknowns must be recognized as part of the validation space, particularly when uncertainty varies systematically across geographies. Moreover, we find that communities most affected by social vulnerability often face the greatest data uncertainty, reinforcing patterns of epistemic injustice. These findings support the integration of MOE as a core design component in composite indices and advocate for scenario-based, uncertainty-aware frameworks. This reframes index construction from a technical task into one of epistemological humility and methodological responsibility.
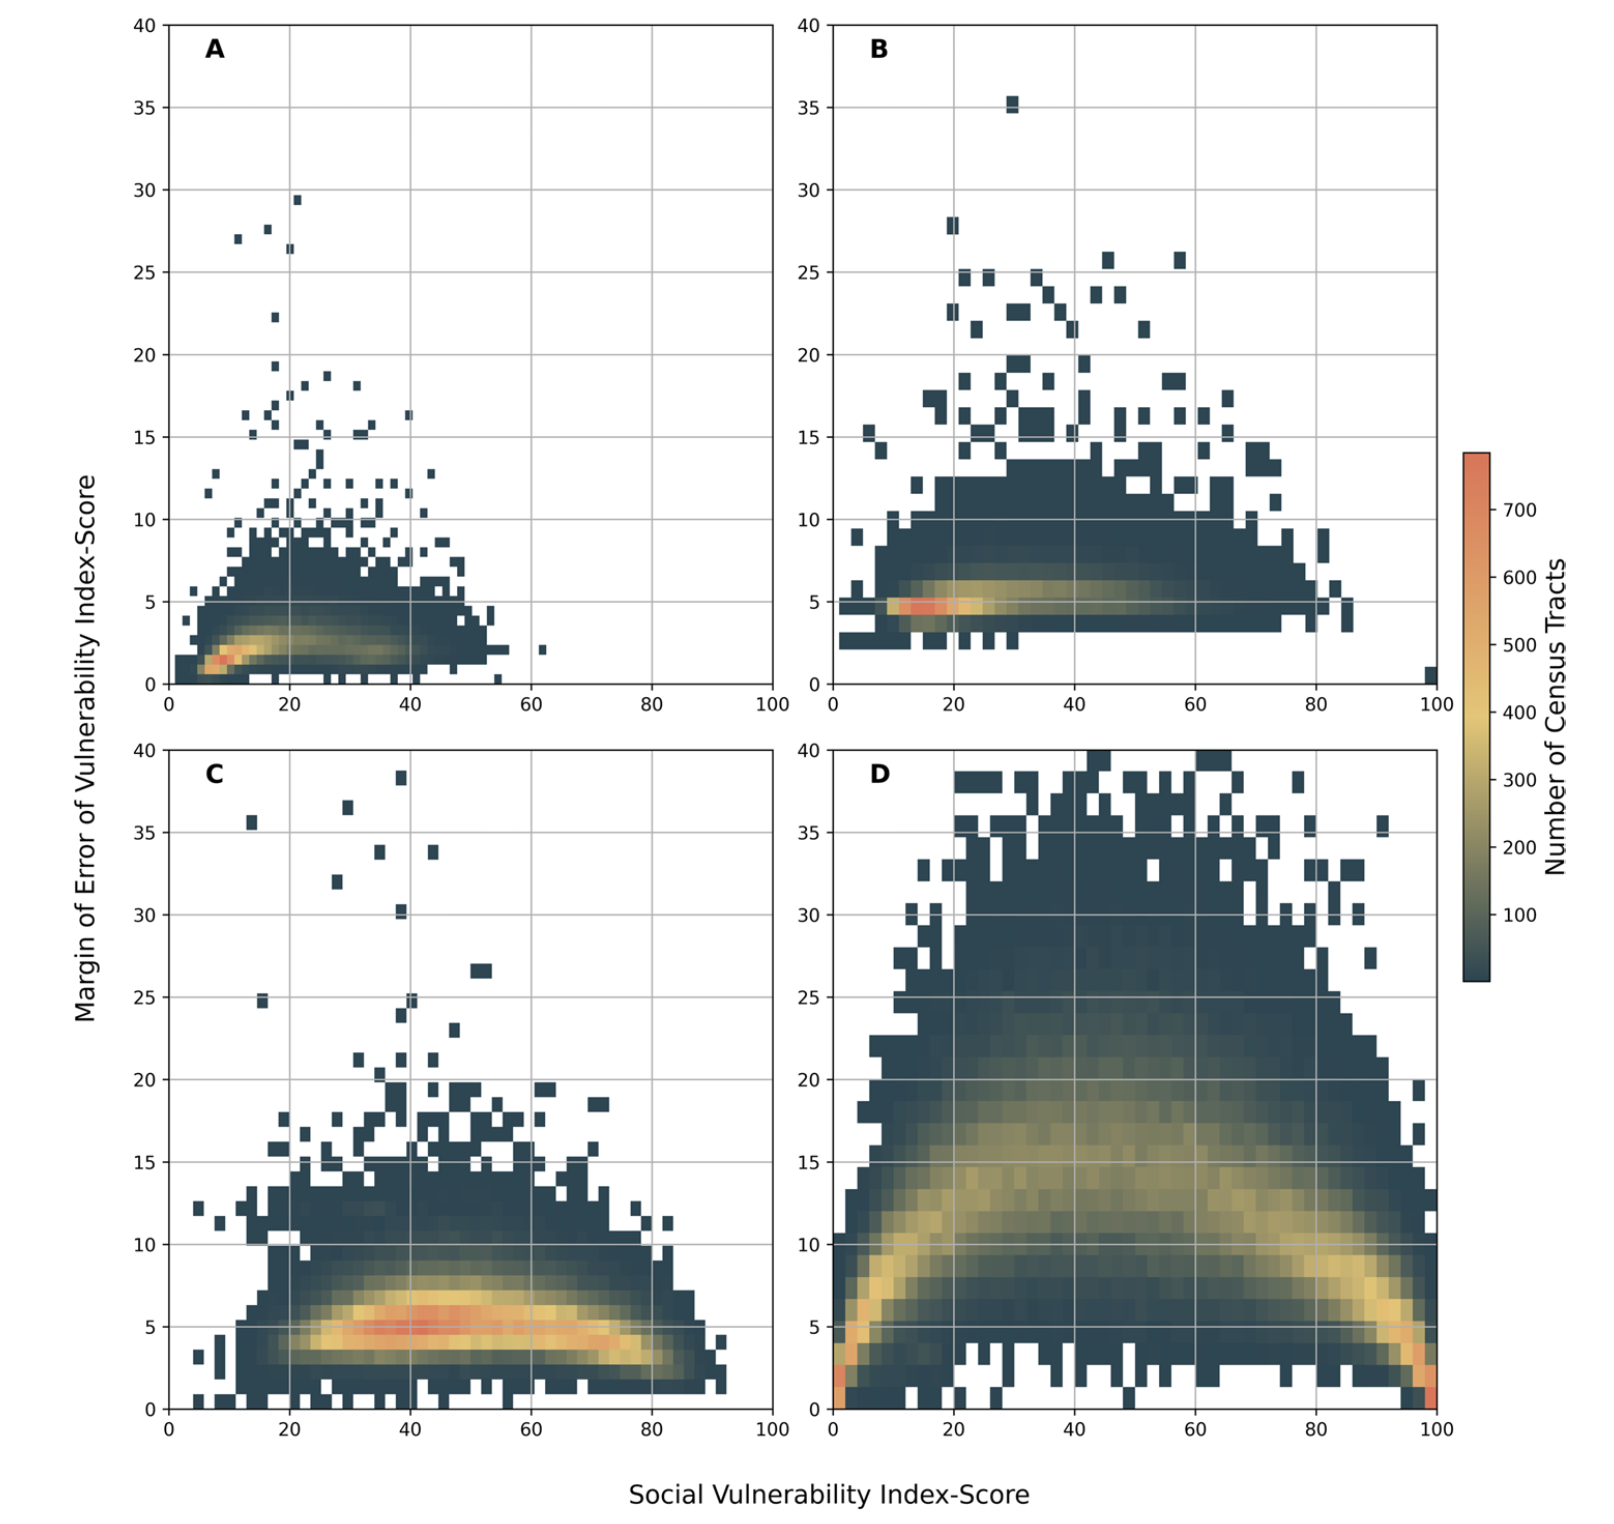
Relationship between Social Vulnerability Index scores and associated margins of error across different methodological configurations.
Understanding human vulnerability to climate change: A global perspective on index validation for adaptation planning
Abstract: Climate change is a severe global threat. Research on climate change and vulnerability to natural hazards has made significant progress over the last decades. Most of the research has been devoted to improving the quality of climate information and hazard data, including exposure to specific phenomena, such as flooding or sea-level rise. Less attention has been given to the assessment of vulnerability and embedded social, economic and historical conditions that foster vulnerability of societies. A number of global vulnerability assessments based on indicators have been developed over the past years. Yet an essential question remains how to validate those assessments at the global scale. This paper examines different options to validate global vulnerability assessments in terms of their internal and external validity, focusing on two global vulnerability indicator systems used in the WorldRiskIndex and the INFORM index. The paper reviews these global index systems as best practices and at the same time presents new analysis and global results that show linkages between the level of vulnerability and disaster outcomes. Both the review and new analysis support each other and help to communicate the validity and the uncertainty of vulnerability assessments. Next to statistical validation methods, we discuss the importance of the appropriate link between indicators, data and the indicandum. We found that mortality per hazard event from floods, drought and storms is 15 times higher for countries ranked as highly vulnerable compared to those classified as low vulnerable. These findings highlight the different starting points of countries in their move towards climate resilient development. Priority should be given not just to those regions that are likely to face more severe climate hazards in the future but also to those confronted with high vulnerability already.
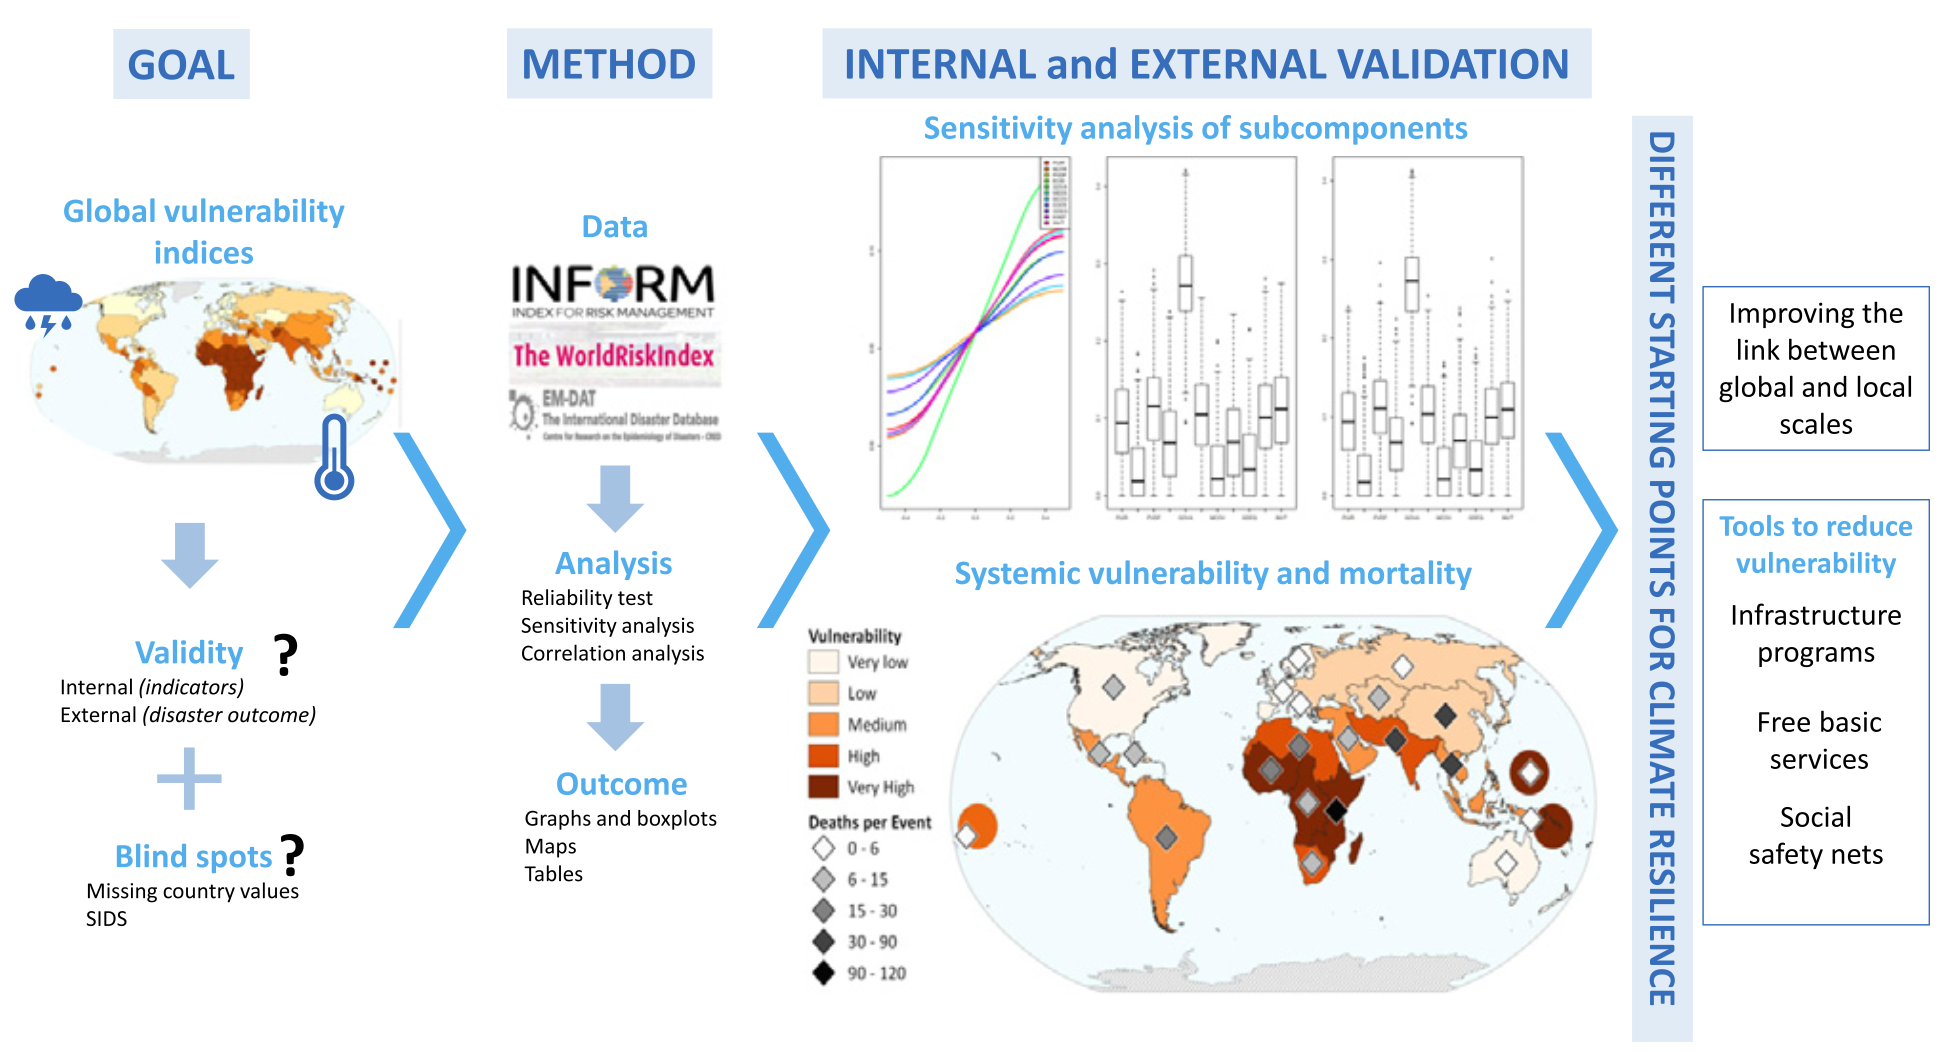
GRAPHICAL ABASTRACT
An open resilience index: Crowdsourced indicators empirically developed from natural hazard and climatic event data
Abstract: The climate resilience of nations is imperative for a sustainable future. The way that nations respond to climate change needs to adapt from a reactive and backward-focused disaster management approach, to become more proactive and to anticipate what is yet to come. Two key challenges restrict climate resilience. First, the social aspects are relevant to resilience, yet many such aspects are not adequately reflected by available statistics. Second, validating indicators of climate resilience is demanding in terms of data availability and methodology. To overcome these challenges, we develop an Empirical Evidence Resilience Index (EERI) based on the Emergency Event Data Base (EM-DAT) to measure resilience. However, just the measurement of resilience does not provide the explanation necessary to determine planning strategies. Therefore, to understand resilience better, we also use statistics from OpenStreetMap (OSM) to predict the EERI and deduce explanatory elements. This step is achieved with a random forest method. We call the resulting prediction of resilience (EERI) from OSM data the Open Resilience Index (ORI). The used explanatory elements from OSM not only cover the physical characteristics of infrastructures, but also include country-level socio-economic information. The results show the relevance of social cohesion (identity & mobility; religion); human development (leisure & recreation, social fabric); economy (economic status; material supply); sustainable infrastructure (available infrastructure; spatial development); and nature conservation for resilience.
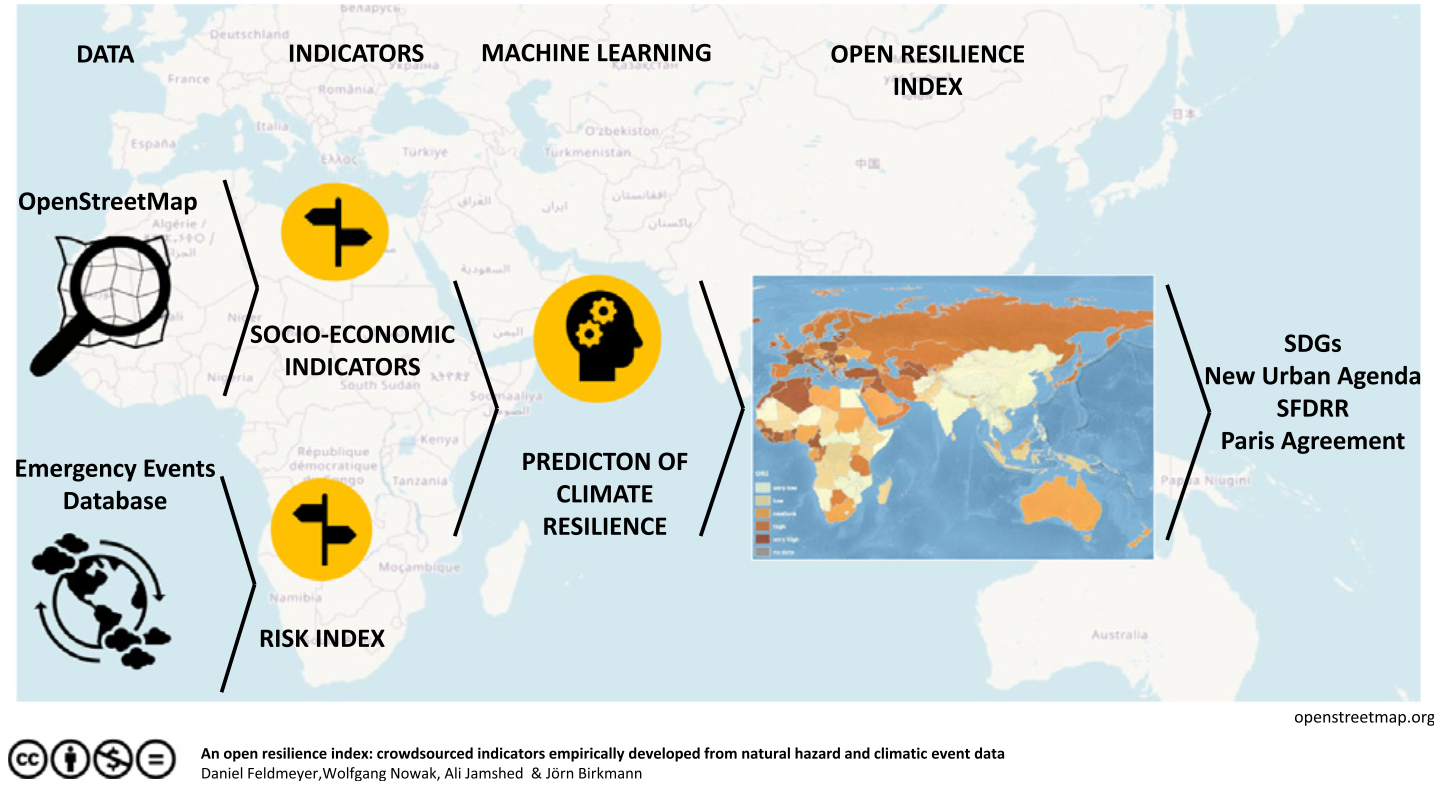
GRAPHICAL ABSTRACT
Characterizing forest vulnerability and risk to climate-change hazards
Abstract: Wildfires, drought, insect outbreaks, and windstorms are altering the forest- associated ecosystem services that are essential for human well- being, and the impacts of such events are likely to increase under ongoing climate change. However, a widely accepted and operational framework for evaluating forest vulnerability and risk to these disturbances remains lacking. We propose a general framework to assess forest vulnerability and risk based on the widely used concepts of exposure, hazard magnitude, suscepti bility, and lack of adaptive capacity as defined by the Intergovernmental Panel on Climate Change. We suggest a standardized procedure for defining and combining these components, as well as a list of indicators readily applicable to the primary hazards to forests associated with climate change. This framework and its methodology constitute a basis for a systematic assessment of forest risk and vulnerability for policy makers, as well as for forest and land managers, that can aid in the development of forward-looking policies.
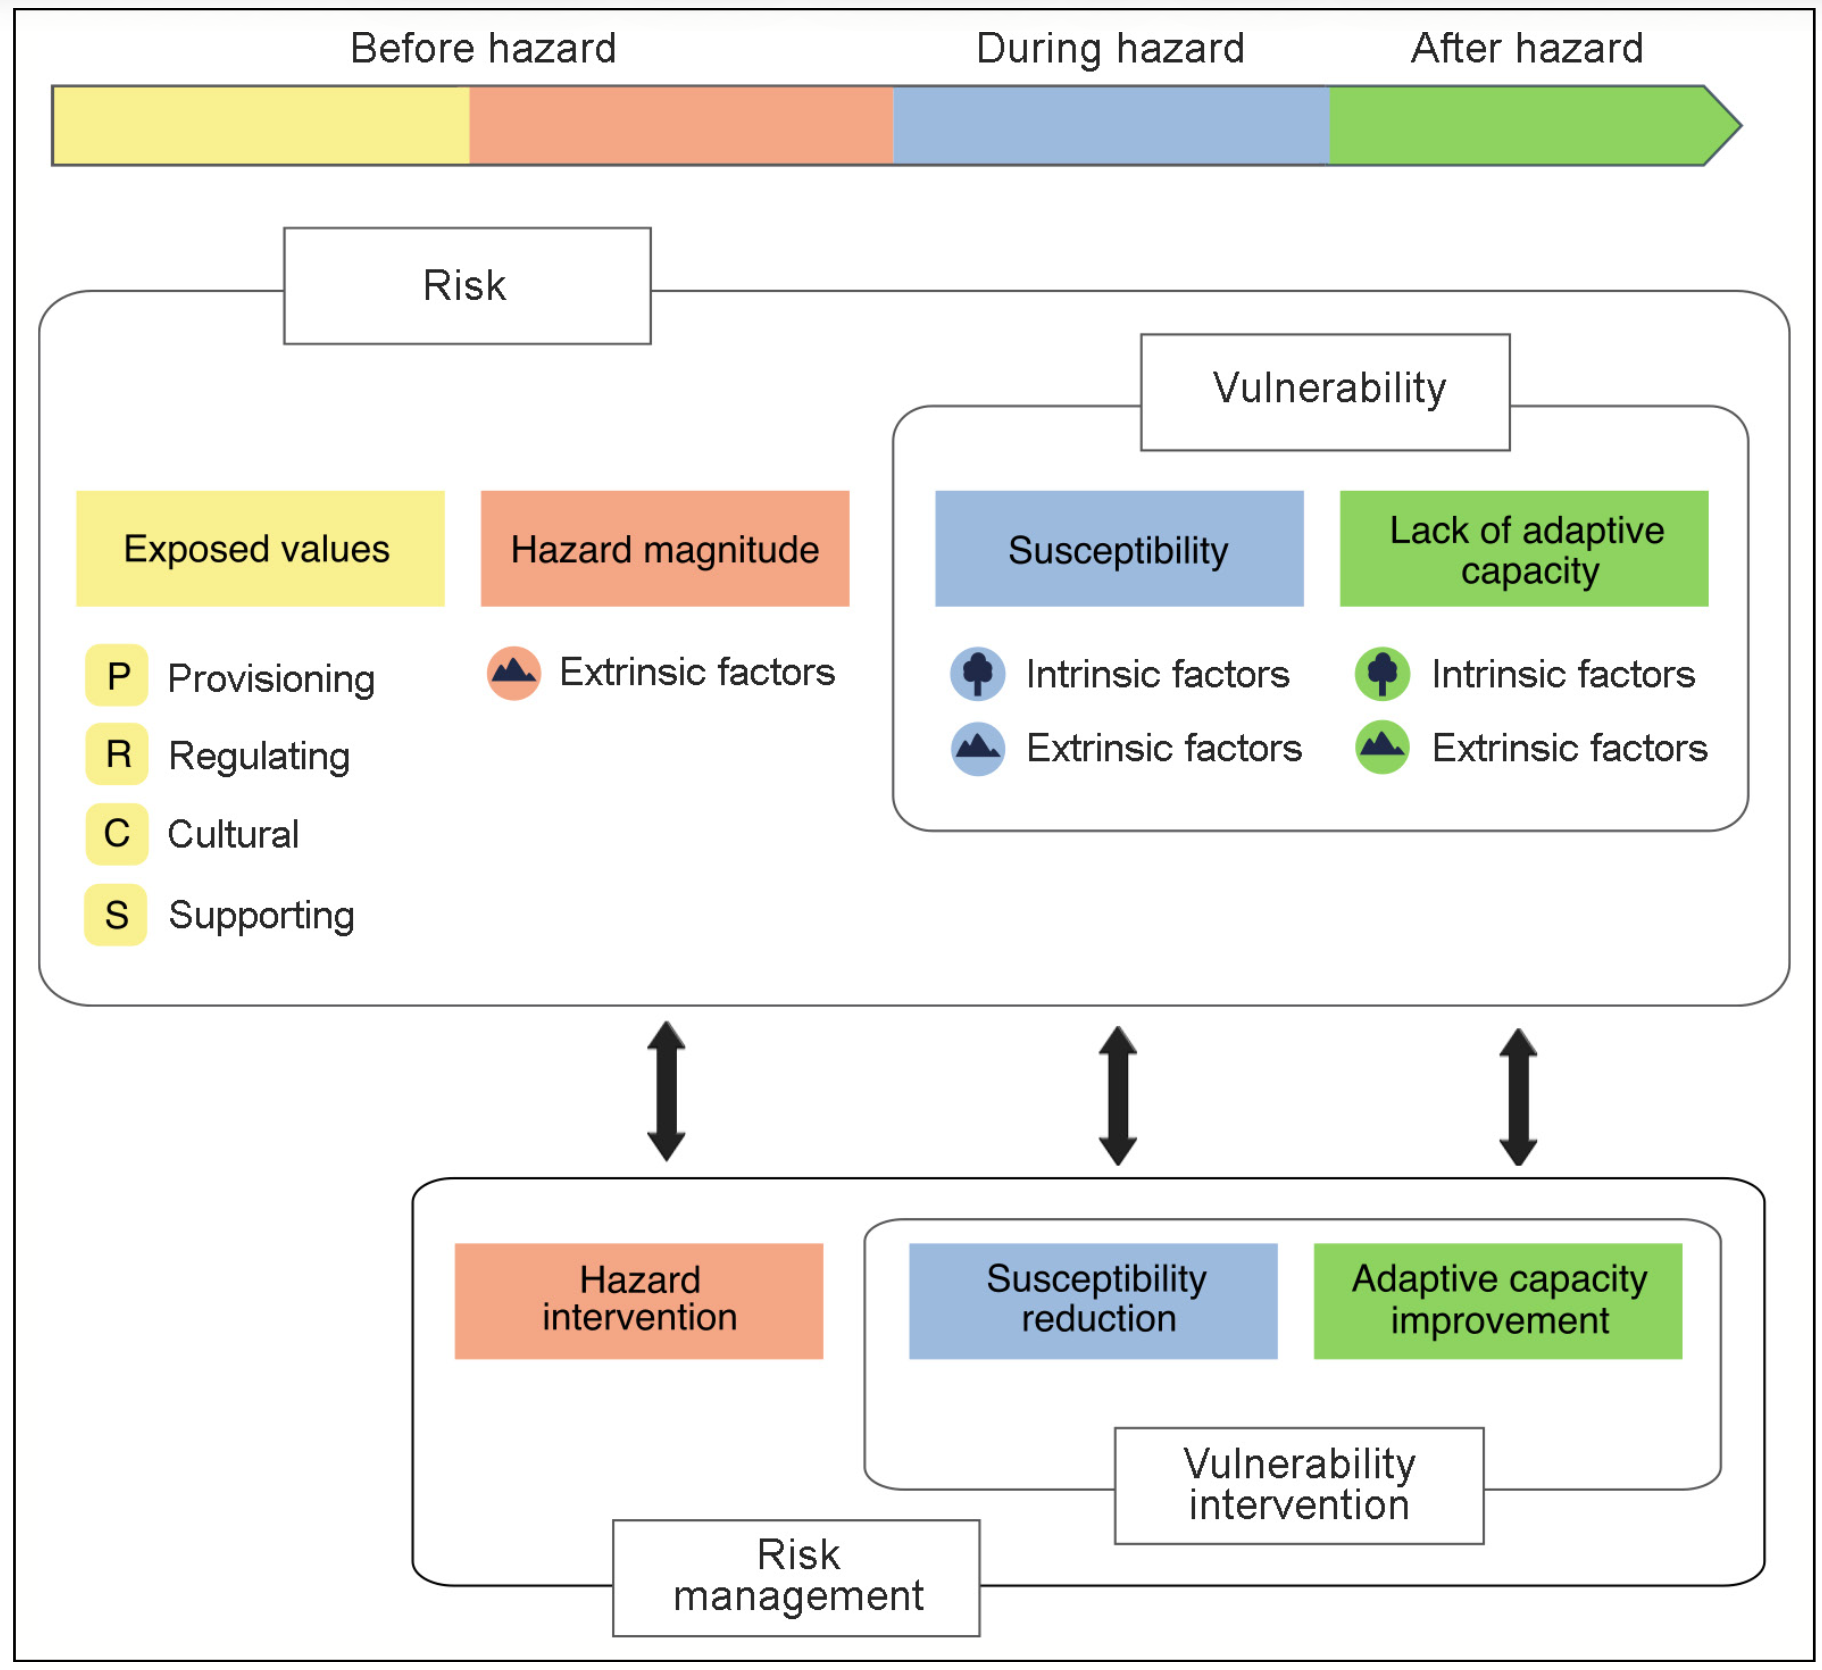
General framework of forest vulnerability and risk to climate- change hazards and its temporal dimension (before, during, and after hazard). See main text for details.
Empirical validated indicator set for measuring knowledge and action changes in the light of urban climate resilience
Abstract: Climate resilience has gained an essential role in research as well as in international policies. An increasing number of cities are adapting to climate change to enhance their climate resilience. Given the complexity of urban systems in combination with the acceleration of climate and social change, it is challenging to measure the success of resilience‐rising activities. To manage and accelerate the learning process and the transformation process, monitoring and evaluation of implemented adaptation measures are crucial. Most of the currently used indicator sets are dealing with system‐focused changes. However, actor‐focused changes are less addressed in holistic indicator sets, even if individual agency assumes an important role in the transformation process. This research was intended to design a framework for individual climate resilience agency and operationalise it in a composite indicator set. The indicator set is implemented in a survey with 14 research projects in Germany. Finally, the indicator set is verified using statistical and empirical validation. The study presents an applicable indicator set, which reveals more in‐depth insights into the individual climate resilience agency and changes within adaptation measurements. Further, the set can be applied in both one‐time assessments and repetitive measurement. Therefore, the tool can be implemented as a monitoring tool, as well as a formative evaluation tool, in the climate resilience adaptation context.
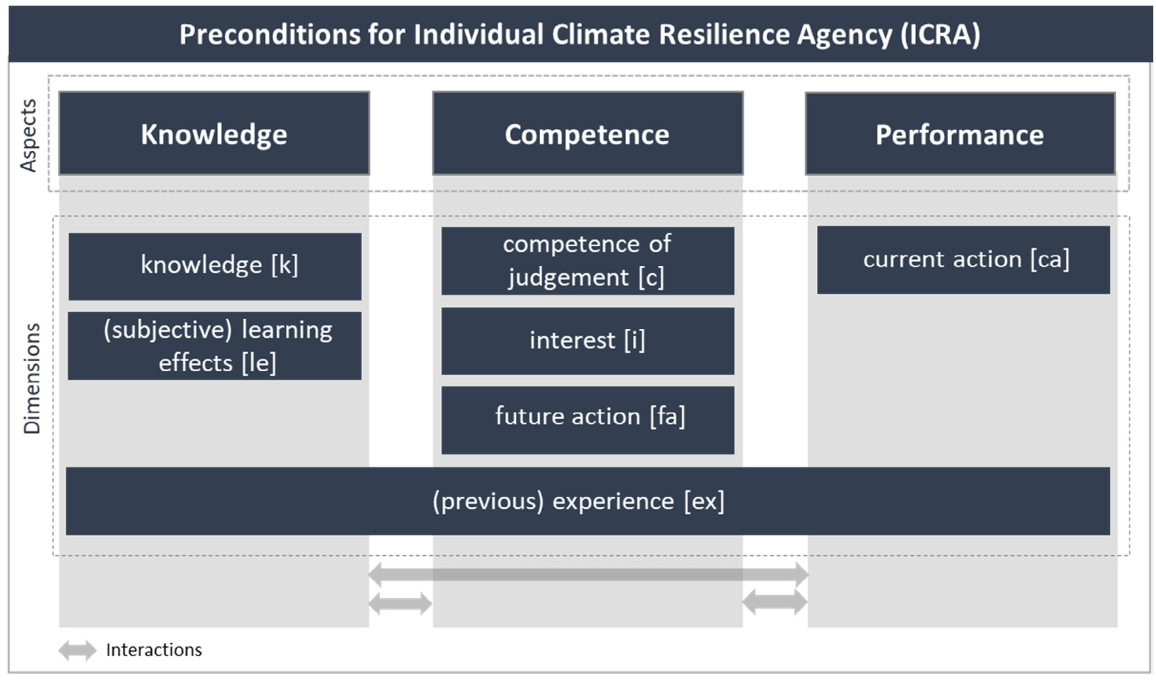
Deconstructed preconditions for individual climate resilience agency (ICRA).
Global vulnerability hotspots: differences and agreement between international indicator-based assessments
Abstract: Climate change impacts and their consequences are determined not only by the intensity and frequency of different climatic hazards but also by the vulnerability of the system, society or community exposed. While general agreement exists about the importance of assessing vulnerability to understand climate risks, there is still a tendency to neglect global and regional vulnerability patterns because they are hard to quantify, despite their value in informing adaptation, disaster risk and development policies. Several approaches to quantifying global vulnerability exist. These differ in terms of the indicators they use and how they classify countries or regions into vulnerability classes. This paper presents the structure of selected approaches and explores two indices in depth. The aim of this study is to assess the level of agreement between selected international indicator-based assessments of vulnerability at the level of climate regions. Results suggest that the two major global vulnerability assessments analysed largely agree on the location of the most and least vulnerable regions when these assessments are aggregated to a regional scale using the IPCC’s climate regions. The paper then discusses the robustness of the information derived and its usefulness for adaptation, disaster risk and development policies. Measuring progress towards reducing vulnerability to climate change and hazards is key for various agencies and actors in order to develop informed policies and strategies for managing climate risks and to promote enabling conditions for achieving the SDGs and building resilience.
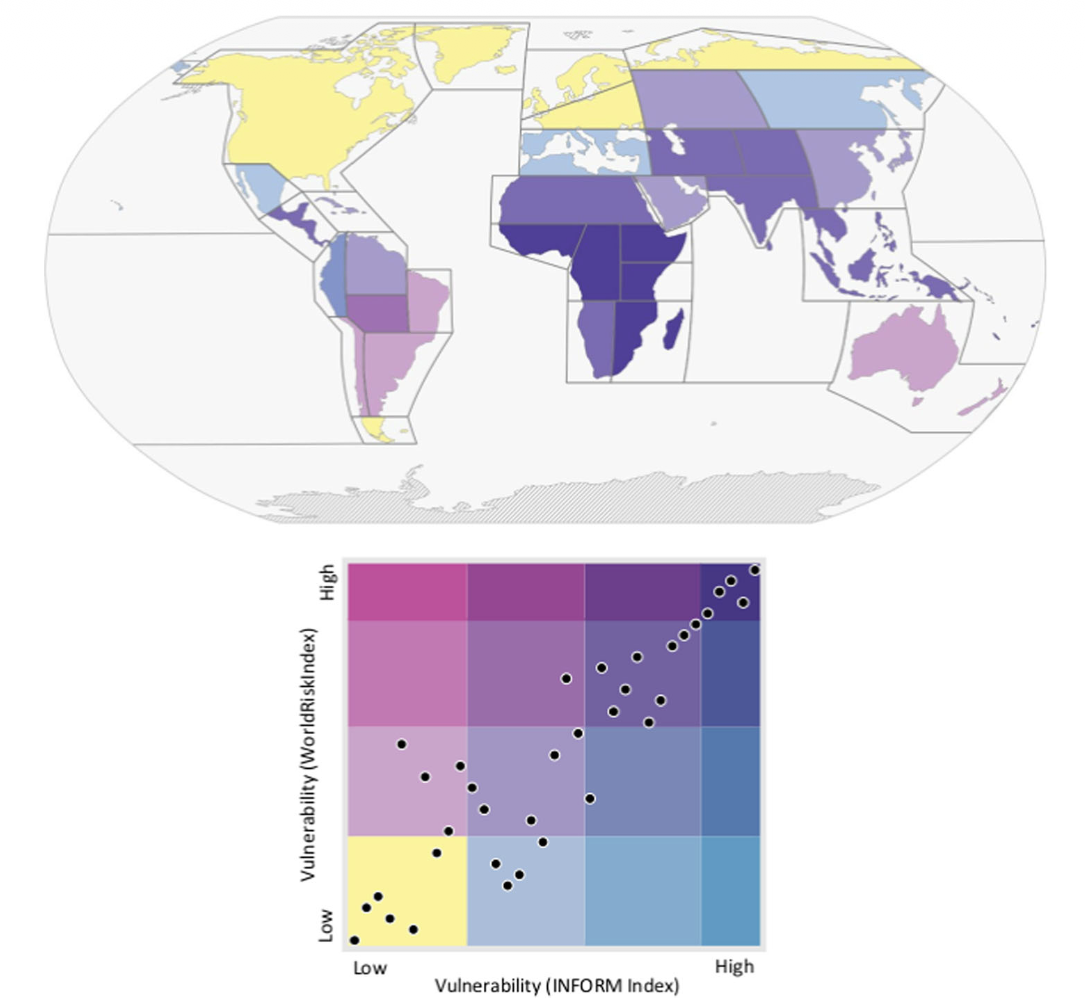
Bivariate choropleth map and scatter plot diagram legend showing the agreement between two globa fvulnerability indices (WorldRiskIndex and INFORM Index) when ranking of climate regions according to their vulnerability. Darker colours show regions of higher vulnerability. The diagram legend shows how the 35 climate regions are ranked by each index. Source: Own map based on the rankings of the INFORM Index (INFORM 2019) and the WorldRiskIndex (Feldmeyer et al. 2017)
Regional clusters of vulnerability show the need for transboundary cooperation
Abstract: Reducing vulnerability is essential for adaptation to climate change. Compared to approaches that examine vulnerability to a specific hazard, our analysis offers an alternative perspective that conceptualizes vulnerability to climate change as a phenomenon that is independent of any specific type of hazard but relevant to multiple hazards. Vulnerability is thus a product of structural inequality and systemic in nature. Based on two established index systems, we perform global analyses of specific phenomena-such as poverty, access to basic infrastructure services and forced migration-that influence and determine vulnerability. Our statistical and spatial analyses reveal an emerging pattern of climate vulnerability within regional clusters and shows that vulnerability is a transboundary issue, crossing political, sectorial and geographical borders and impacting shared resources. The spatial statistical hotspot analysis of vulnerability underscores that hotspots, for example of high vulnerability, state fragility, low biodiversity protection or forced migration, emerge in multi-country clusters. This aspect has often been overlooked, most attention to-date having been given to the positioning of individual countries within vulnerability rankings. In hotspots such as in the Sahel, East and Central Africa, as well as in Southern Asia and Central America, vulnerability is interwoven with high levels of state fragility, making adaptation solutions more complex. The recognition of the regional clusters and the transboundary nature of vulnerability calls for new research and action on how to strengthen transboundary approaches for vulnerability reduction, potentially enhancing prospects for successful adaptation.

Hotspot maps. These maps show the results of hotspot analyses of globally available country data (see materials and methods section for data sources).
A Conceptual Framework to Understand the Dynamics of Rural-Urban Linkages for Rural Flood Vulnerability
Abstract: Rural areas are highly vulnerable to floods due to limited social, economic, and physical resources. Understanding rural vulnerability is vital for developing effective disaster risk reduction strategies. Even though rural areas and cities are intrinsically linked, rural vulnerability was assessed without considering its relation to cities. Numerous theoretical frameworks on systemizing and assessing vulnerability were developed with varying level of scope and depth in terms of scale, dimensions, and components. Nevertheless, these frameworks did not explicitly mention the impact of flood or other hazards on the linkages between spatial units i.e., rural and urban. This study aims to understand and conceptualize the rural vulnerability with respect to the dynamics of rural–urban linkages in the case of flood events. To do so, current literature on rural–urban linkages, vulnerability, as well as factors that influence them were critically reviewed. Taking into account the main elements of rural–urban linkages (flow of people, information, finances, goods and services), components of vulnerability (exposure, susceptibility, and capacity), and factors (social, economic, institutional, infrastructural, spatial, and environmental), a unified framework is proposed. The framework underscores that the role of rural–urban linkages is essential to fully understand rural flood vulnerability. Moreover, the framework highlights the role of spatial factors—city size and proximity to the city—as crucial to comprehend rural vulnerability. This framework can be used as a tool for understanding multifaceted rural vulnerability for climate change adaptation and disaster risk reduction considering spatial development perspective. In this context, empirical investigations can be made to validate the proposed framework and policies can be introduced accordingly. Overall, the proposed framework can help recognize concepts and links of vulnerability, rural–urban dependencies, and rural development dynamics.
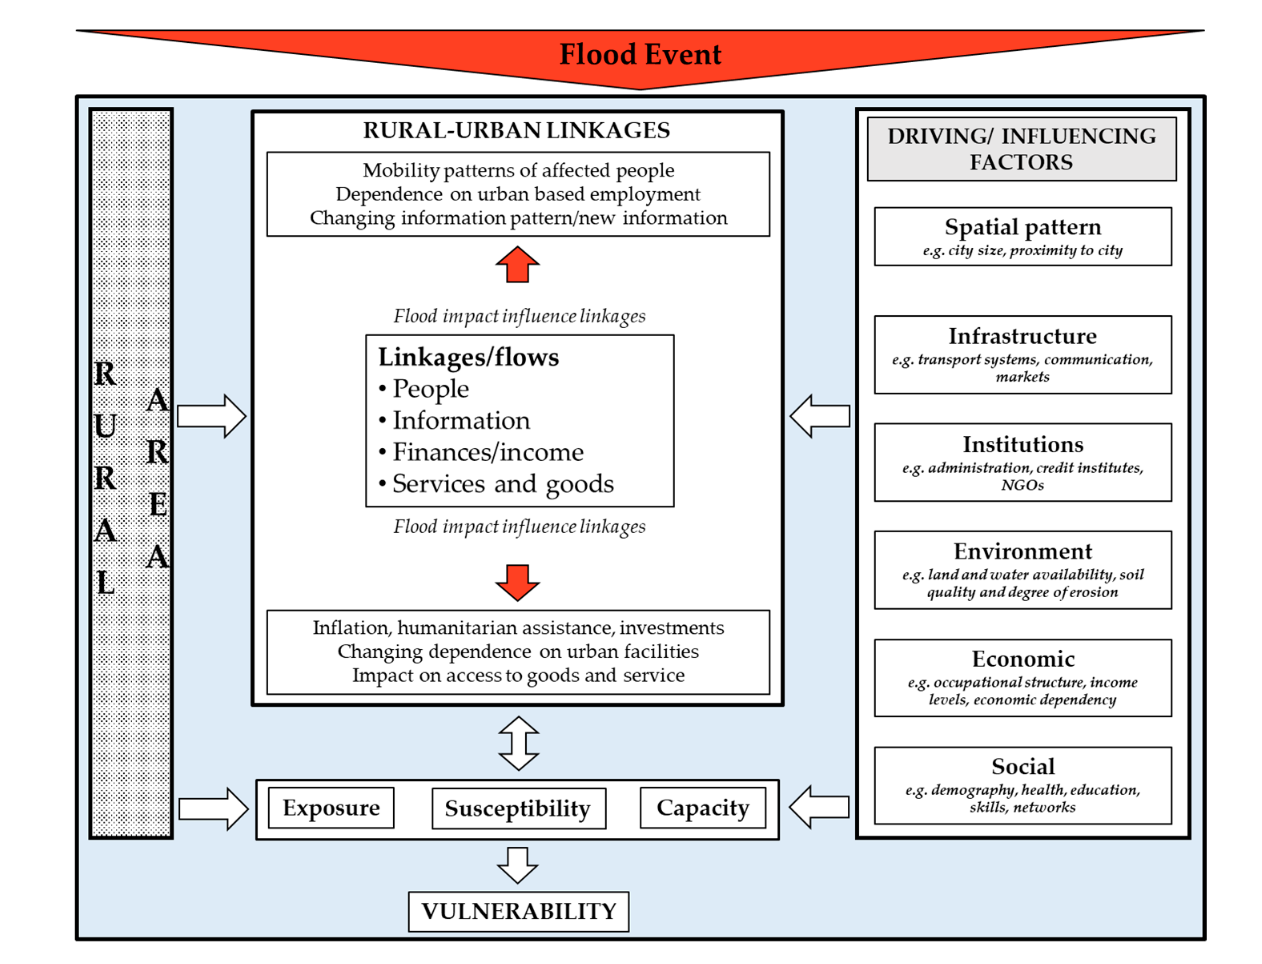
A conceptual framework to understand the dynamics of rural–urban linkages and its influence influence on rural flood vulnerability
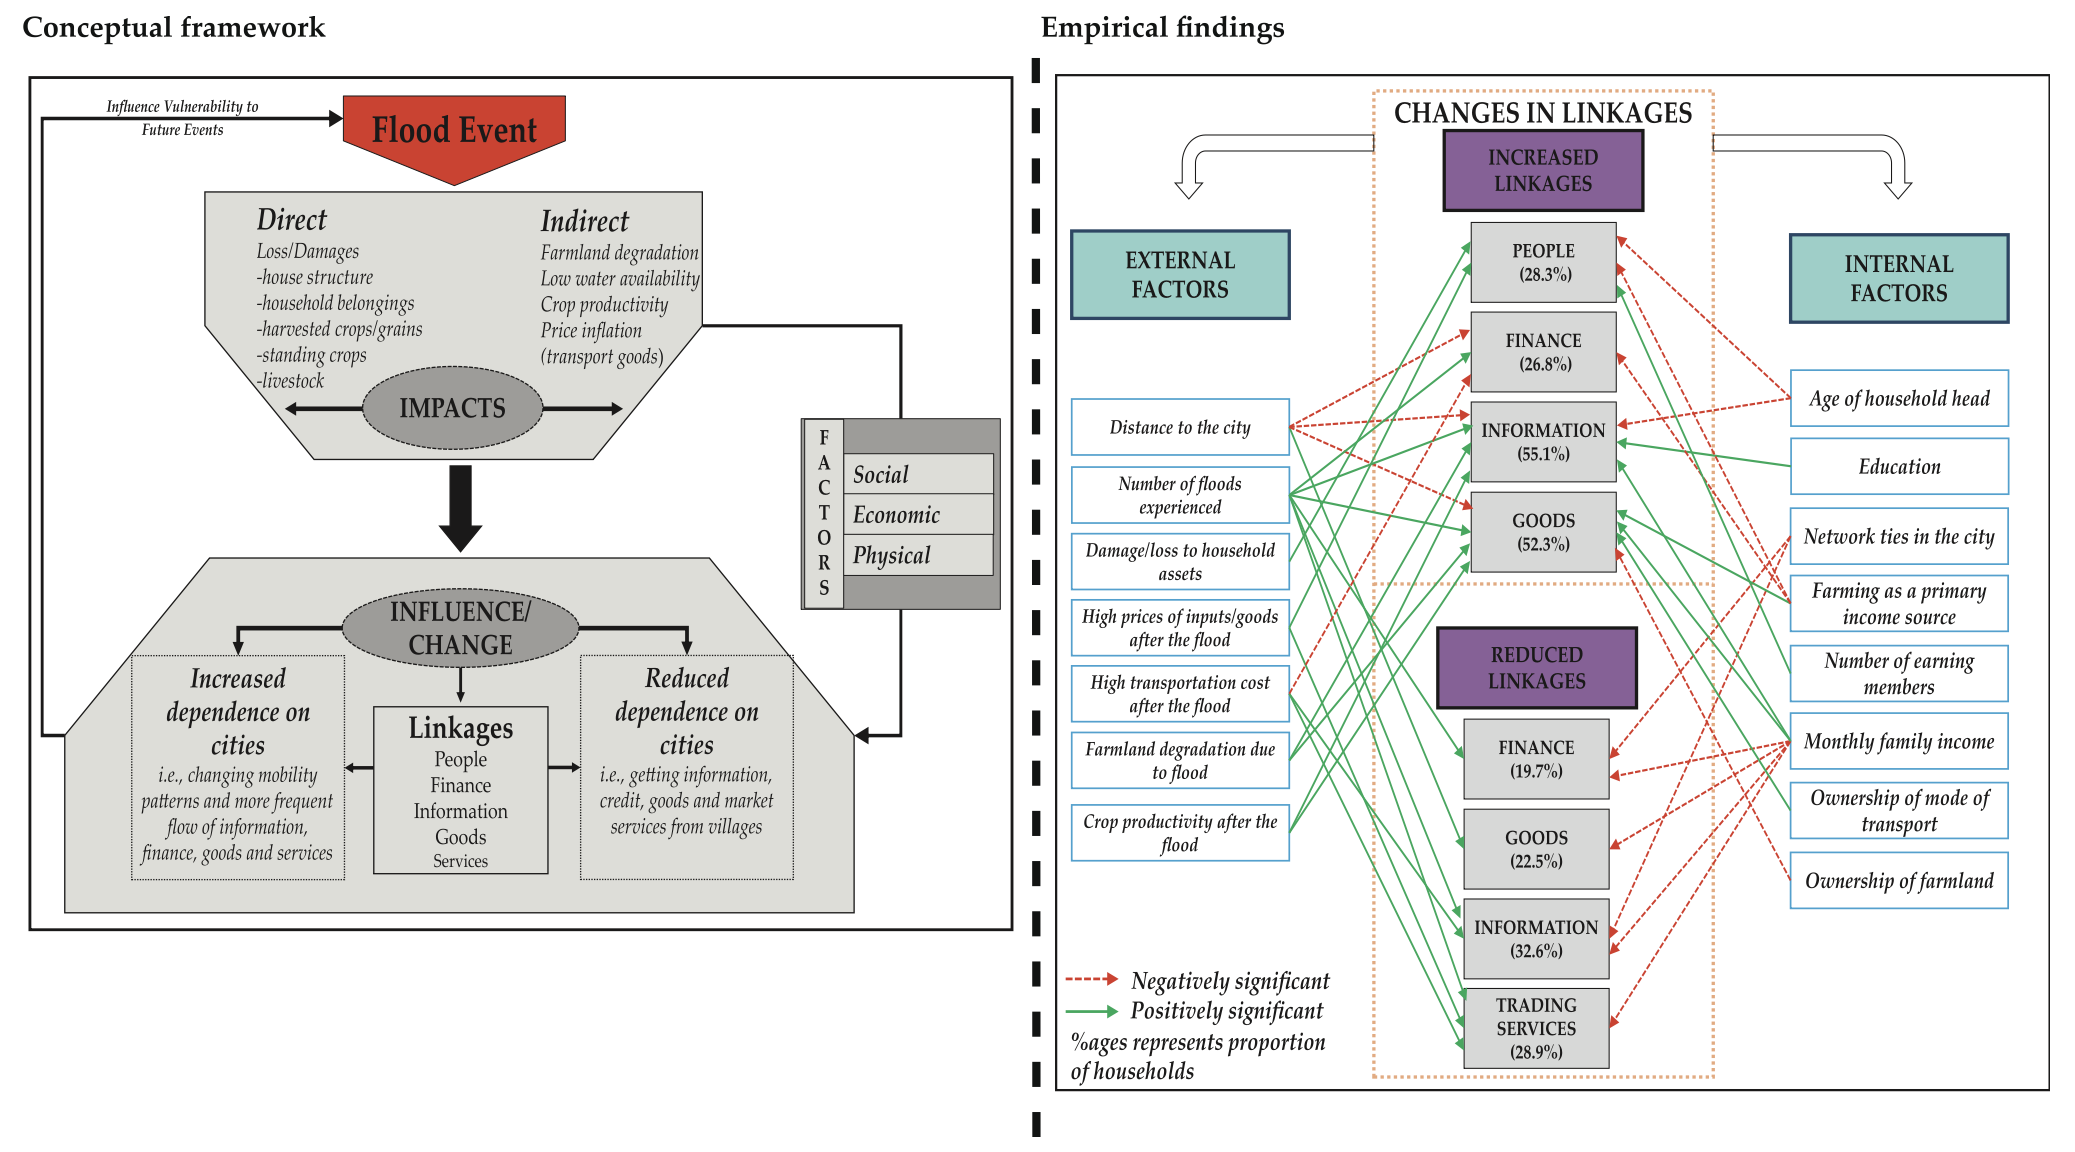
How rural-urban linkages change after the extreme flood event? Empirical evidence from rural communities in Pakistan
Abstract: Extreme flood events can lead to dramatic changes in societal processes, disrupt rural-urban linkages and affect rural vulnerabilities. Changes in rural-urban linkages due to extreme flooding have been theoretically discussed with limited empirical evidence. Therefore, this study investigates the impacts of a flood event on linkages between rural and urban areas of Pakistan. This study also examines socioeconomic and spatial factors that can influence changes in rural-urban linkages. Three case studies were selected from the Punjab province of Pakistan, and a total of 325 samples were collected through household surveys. Descriptive statistics, binary logistic regression and correlation analysis were conducted to analyse the data. The findings show that flooding has severely affected rural communities directly and indirectly. This paper details the many different ways in which floods can change rural linkages with cities-i.e., the flow of people, information, finance, goods and services between rural and urban areas. The results also reveal that the age of household head, education, income and farming occupation are influential factors that affect how rural-urban linkages change. Most importantly, the research highlights that extreme flooding can both increase and decrease the dependence of rural communities on cities in different ways. This indicates that linkages between rural and urban areas need to be strengthened in order to reduce flood-related vulnerabilities. This study paves the way for regional planners and disaster managers to establish synergies for developing integrated flood risk management and development strategies.
GRAPHICAL ABSTRACT
Regional climate resilience index: A novel multimethod comparative approach for indicator development, empirical validation and implementation
Abstract: High uncertainty in the occurrence of extreme events and disasters have made resilience-building an imperative part of society. Resilience assessment is an important tool in this context. Resilience is multidimensional as well asplace-,scale-andtime-specific,which requires a comprehensive approach for measuring and analysing.In this regard,composite indicators are preferred,and extensive literature is available on resilience indices on all spatial and temporal scales as well as hazard-specific or multi-hazard related indicators. However, transparent, robust, validated and transferable metrics are still missing from the scientific discourse. Hence, the research follows a novel composite index development approach: First, to develop and operationalise climate resilience on the county level in the state of Baden-Württemberg, Germany; second, to develop multiple composite indices in order to assess the impact of the construction methodology to increase transparency and decrease uncertainty; third,validating the index by statistical as well as empirical data and machine learningmodels-which is a novel endeavour so far.The results underscored that the two step inclusive validationlof data-driven statistical analysis in combination with empirical data proved to be essential in developing the index during the selection and aggregation of indicators. The results also highlighted a lower climate resilience of rural regions compared to metropolitan regions despite their better environmental status. Overall, machine learning proved to be essential in understanding and linking indicators and indices to policy, resilience and empirical data. The research contributes to a better understanding of climate resilience as well as to the methodological construction of composite indicators.
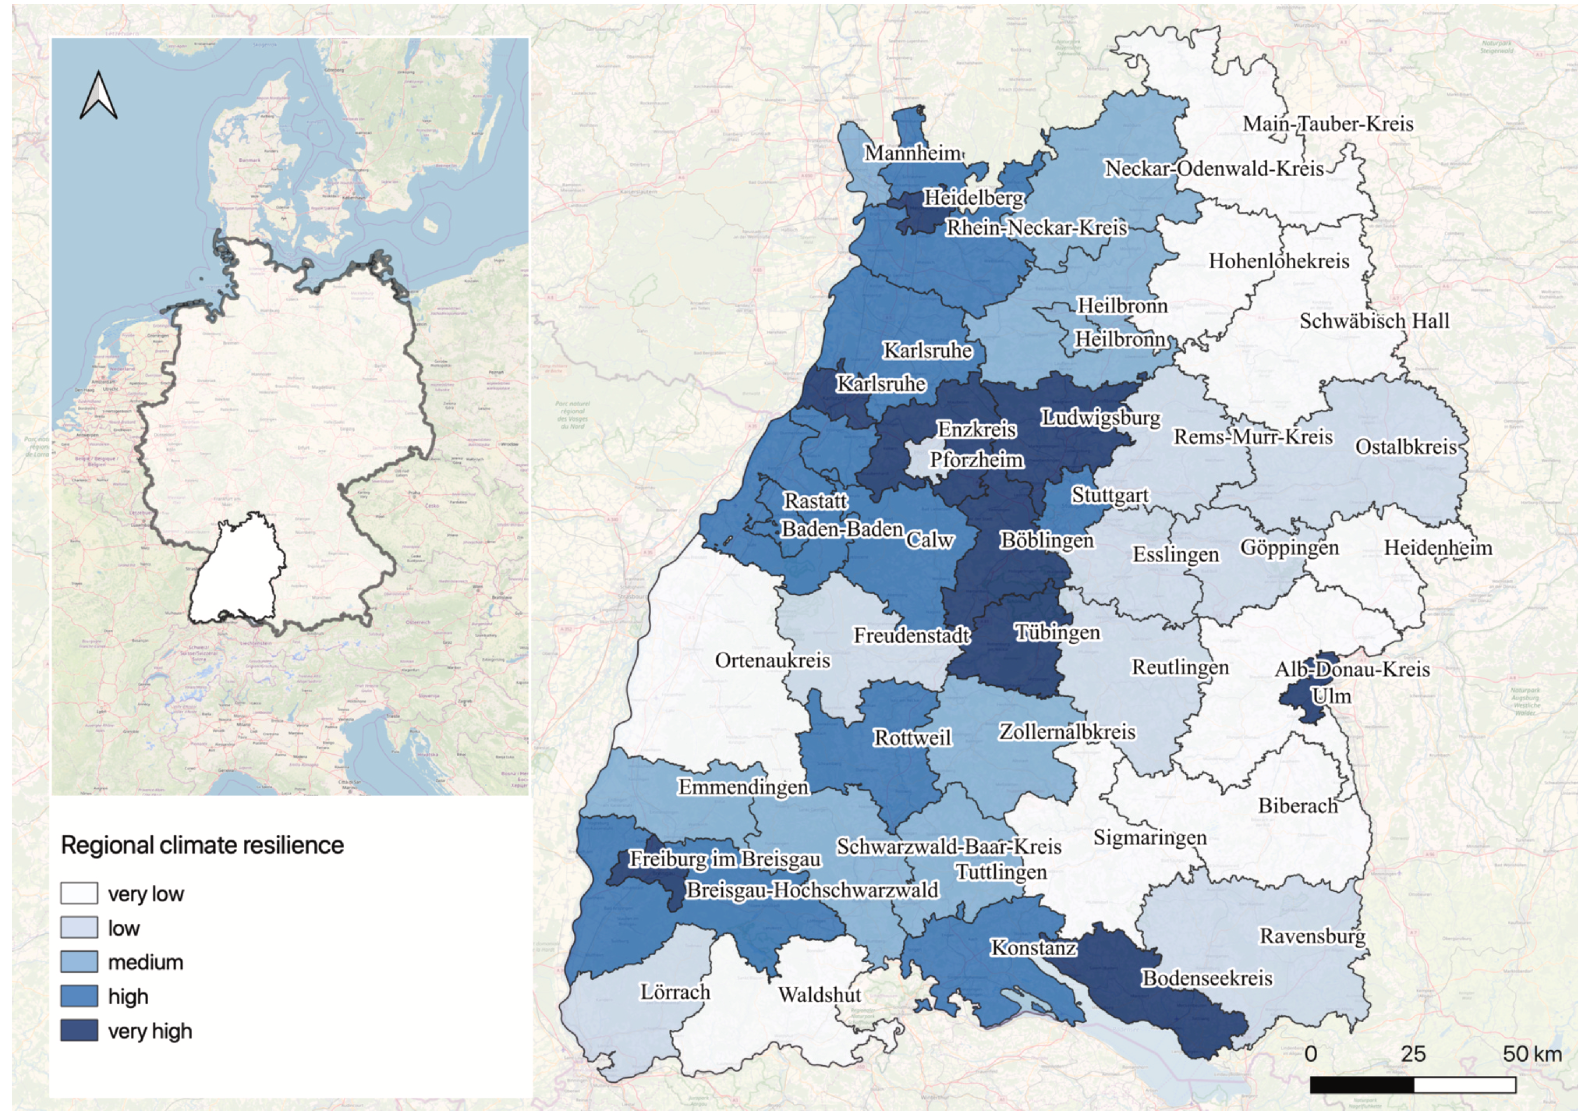
Map of the regional climate resilience index in Baden-Württemberg (resilience classes are based on quantiles).
The effect of spatial proximity to cities on rural vulnerability against flooding: An indicator based approach
Abstract: Vulnerability to environmental hazards has widely been assessed in disaster risk science and climate change literature by integrating socio-economic and geographical features of a community or a place. However, the role of spatial proximity to cities - an important geographical feature - in influencing household vulnerability has not been scrutinized. This paper assesses how distance to cities affects the vulnerability of rural farming communities against flood hazard. This paper proposes a Vulnerability-Proximity Nexus (VPN) framework and operationalises it in the context of Pakistan. A household survey was conducted to collect primary data from three flood-affected sub-districts of Punjab province. A total of 325 samples were collected, out of which 164 samples were from villages located near to the cities and 161 were far from the cities. Vulnerability indices were developed through holistic (exposure, susceptibility, and capacity) and livelihood (human, social, financial, physical, and natural) perspective of vulnerability. Mann-Whitney U and Pearson's correlation tests were performed to analyse linkages between distance and vulnerability. Results confirmed that the distance to the cities influences the vulnerability of surrounding farming communities. A significant and positive correlation between distance to city and rural livelihood vulnerability was found. Rural farming communities living close to the cities were less vulnerable, mainly due to better transfer of services and facilities from cities, which has also made rural communities more educated, informed, financially strong, and connected with easier access to public and private institutions. This study highlights the importance of regional and rural development discourse for vulnerability and can help disaster managers and planners to establish synergies for designing effective disaster risk reduction policies and strategies.

Vulnerability-Proximity Nexus Framework (VPN).
Using OpenStreetMap Data and Machine Learning to Generate Socio-Economic Indicators
Abstract: Socio-economic indicators are key to understanding societal challenges. They disassemble complex phenomena to gain insights and deepen understanding. Specific subsets of indicators have been developed to describe sustainability, human development, vulnerability, risk, resilience and climate change adaptation. Nonetheless, insufficient quality and availability of data often limit their explanatory power. Spatial and temporal resolution are often not at a scale appropriate for monitoring. Socio-economic indicators are mostly provided by governmental institutions and are therefore limited to administrative boundaries. Furthermore, different methodological computation approaches for the same indicator impair comparability between countries and regions. OpenStreetMap (OSM) provides an unparalleled standardized global database with a high spatiotemporal resolution. Surprisingly, the potential of OSM seems largely unexplored in this context. In this study, we used machine learning to predict four exemplary socio-economic indicators for municipalities based on OSM. By comparing the predictive power of neural networks to statistical regression models, we evaluated the unhinged resources of OSM for indicator development. OSM provides prospects for monitoring across administrative boundaries, interdisciplinary topics, and semi-quantitative factors like social cohesion. Further research is still required to, for example, determine the impact of regional and international differences in user contributions on the outputs. Nonetheless, this database can provide meaningful insight into otherwise unknown spatial differences in social, environmental or economic inequalities.
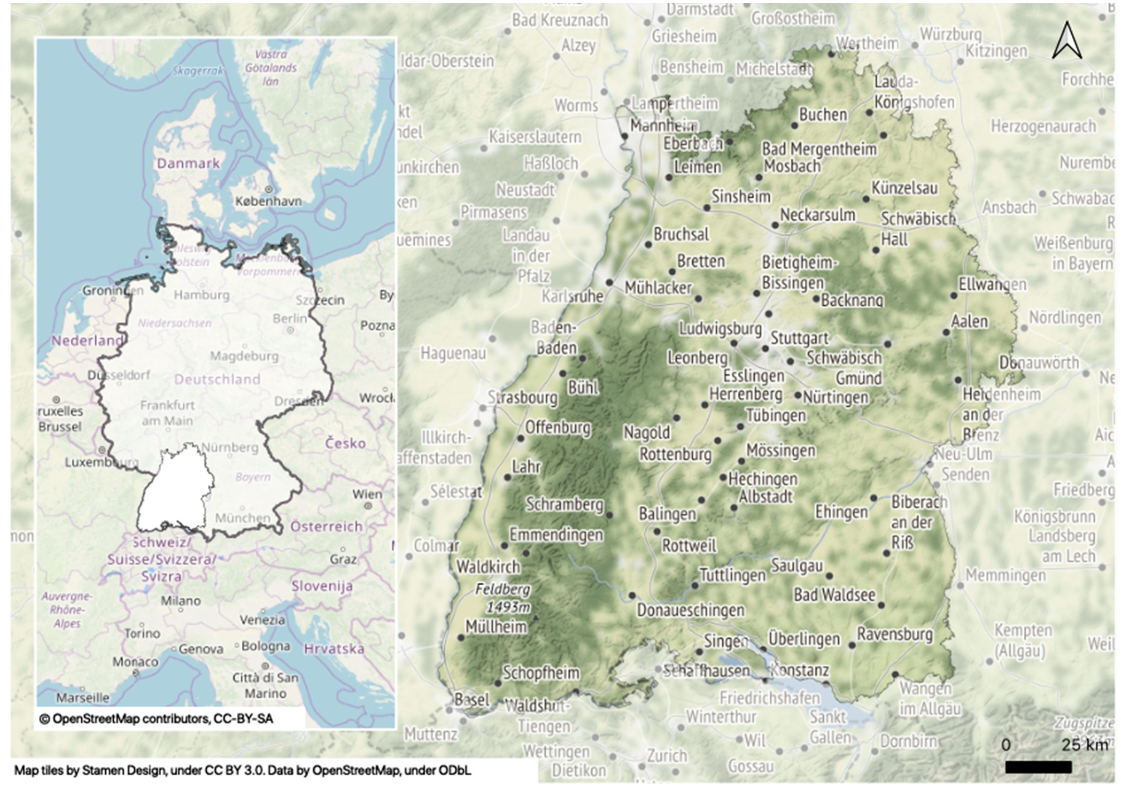
Map of Study Area
Indicators for Monitoring Urban Climate Change Resilience and Adaptation
Abstract: In the face of accelerating climate change, urbanization and the need to adapt to these changes, the concept of resilience as an interdisciplinary and positive approach has gained increasing attention over the last decade. However, measuring resilience and monitoring adaptation efforts have received only limited attention from science and practice so far. Thus, this paper aims to provide an indicator set to measure urban climate resilience and monitor adaptation activities. In order to develop this indicator set, a four-step mixed method approach was implemented: (1) Based on a literature review, relevant resilience indicators were selected. (2) Researchers, consultants, and city representatives were then invited to evaluate those indicators in an online survey before the remaining indicator candidates were validated in a workshop. (3) Indicators were finally reviewed by sector experts. This thorough process resulted in 24 indicators distributed over 24 action fields based on secondary data. The participatory approach allowed the research team to take into account the complexity and interdisciplinary nature of the topic, as well as place- and context-specific parameters. However, it also showed that in order to conduct a holistic assessment of urban climate resilience, a purely quantitative, indicator-based approach is not sufficient, and additional qualitative information is needed.
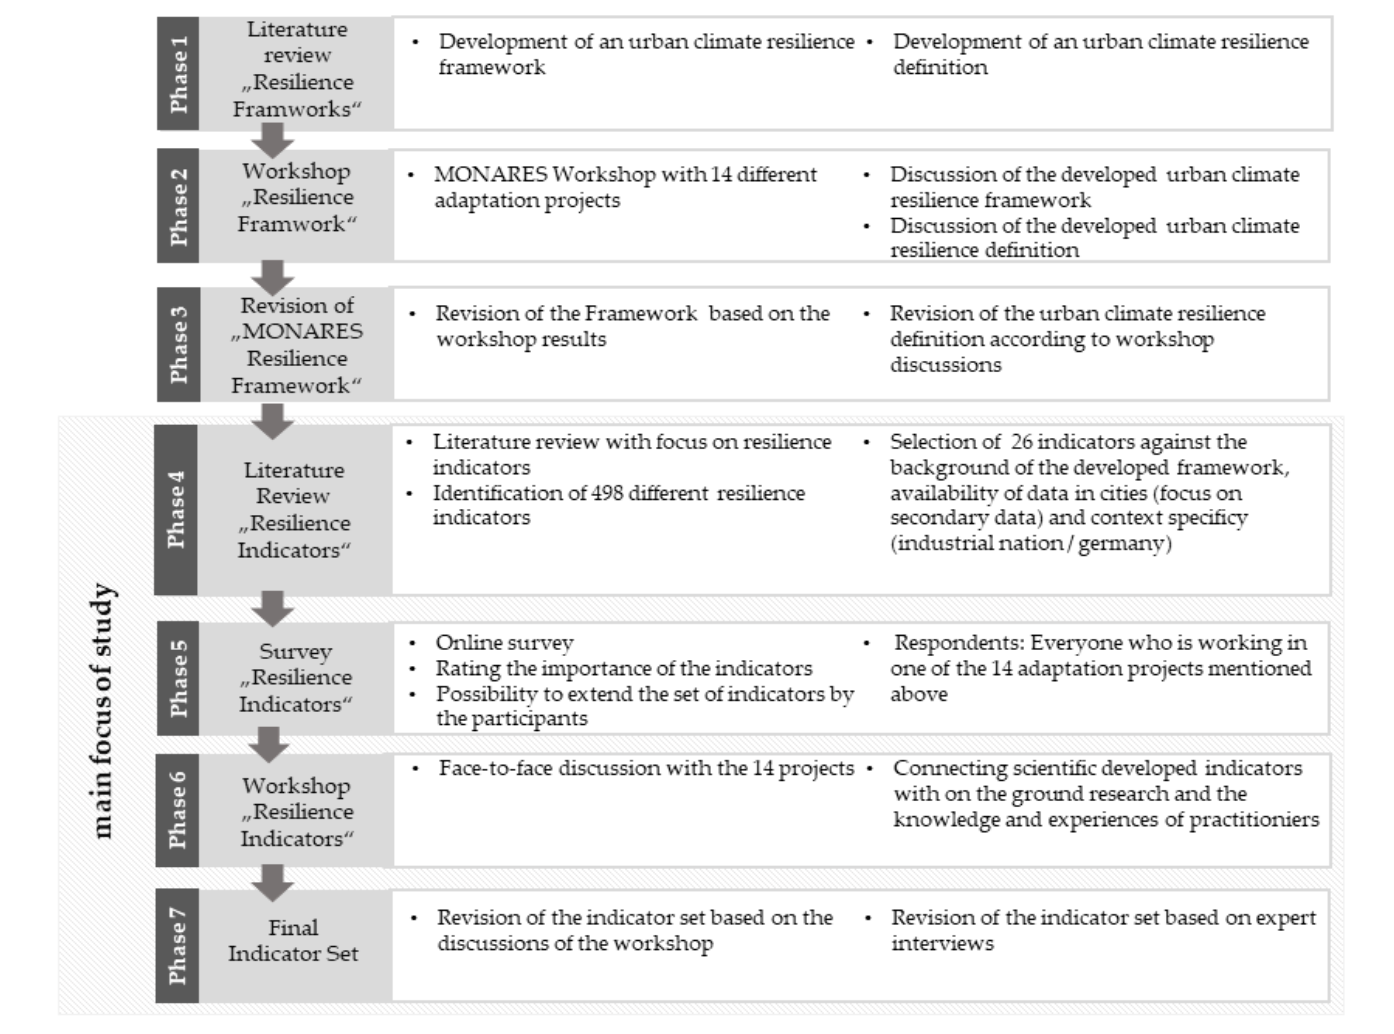
MONARES research process